This is going to be a quick guide in how to use debugging for python files in Chrome OS.
To watch a video version of this post check it out below:
Setup Python and Visual Studio Code on your Chromebook
The first thing you need to do, is to setup your Chromebook to be able to code for python.
That involves installing Linux, Visual Studio Code and setting up some configurations. Check out my guide video below showing you how to do that.
Helpful shortcut keys
It’s also helpful to use function keys. Using function keys with Visual Studio Code, can speed up your productivity, but Chromebooks do not have function keys. You can still use function keys with Chrome OS. To find out how, visit my post link below showing you how.
https://techwiz.family.blog/2021/06/21/using-function-keys-with-a-chromebook-keyboard/
Here are some helpful debugging shortcut keys for Visual Studio Code.
F5: Debug/Continue Debugging
F10: Step Over
F11: Step Into
Shift+F11: Step Out
Ctrl+Shift+F5: Restart Debugging
Shift+F5: Stop Debugging
F9: Set breakpoint
Have some code ready
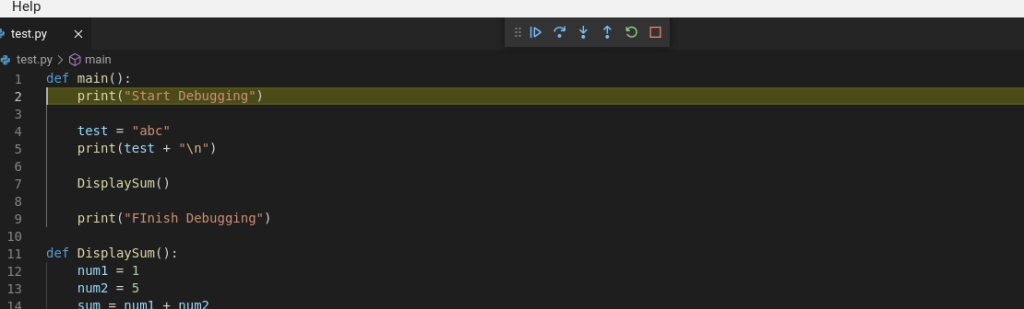
Before we start the debugging process, let’s have some python code ready. Open a folder in Visual Studio Code and create a python file. Then paste the below code.
def main():
    print("Start Debugging")

    test = "abc"
    print(test + "\n")

    DisplaySum()

    print("FInish Debugging")

def DisplaySum():
    num1 = 1
    num2 = 5
    sum = num1 + num2

    print(str(sum) + "\n")

if __name__ == "__main__":
    # execute only if run as a script
    main()
Begin Debuggging
To prepare our code for debugging, we need to first set a breakpoint. A breakpoint is a line of code that we mark for the debugger to freeze execution at. This allows us to check the values of variables and to slowly walk though code to help us fix bugs.
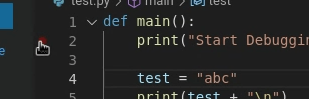
Let’s set a breakpoint at the line that says print(“Start Debugging”). Do that by clicking on the line and hitting the F9 key. Or by moving your mouse next to that line’s number and clicking on the faint red circle that appears.
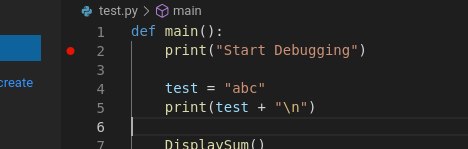
After clicking on the faint red circle, it will change to bright red.
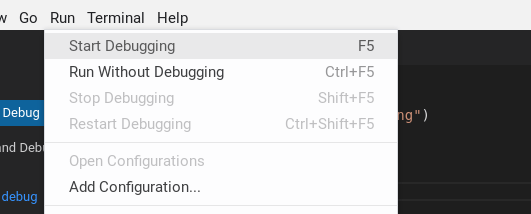
Now to start the debugging, hit F5 on your keyboard or click on Run, then Start Debugging
Some options will appear on the command pallete.
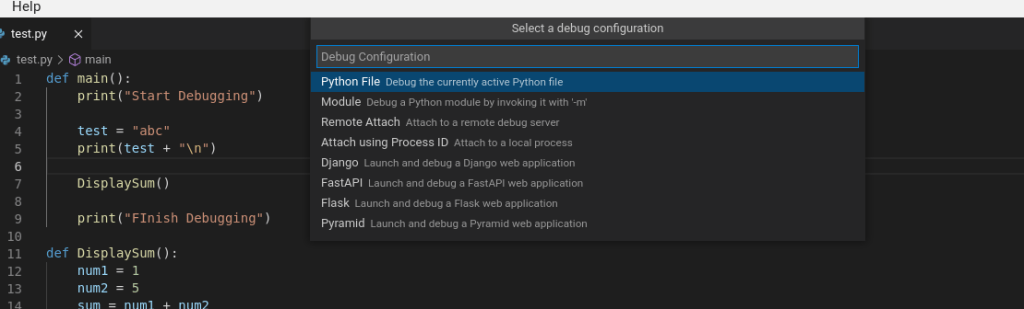
These options are different types of debugging configurations for different python projects. Since we are just debugging a python file, select Python File and debugging will begin and code execution will freeze at and highlight the line we set the breakpoint at.
Some buttons at the top will also appear.
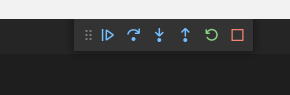
The first button ![]() , is the continue button. When you press it, it will continue code execution until another breakpoint is hit or some error stops the code completely. It’s shortcut key is F5.
, is the continue button. When you press it, it will continue code execution until another breakpoint is hit or some error stops the code completely. It’s shortcut key is F5.
Stepping Over Code – Shortcut key “F10“
The second button![]() , is the Step Over button. This will execute a line of code, but if a line of code contains a method or function, it will not go into that function for further execution. Instead it will execute that function behind the scenes and go to the next line.
, is the Step Over button. This will execute a line of code, but if a line of code contains a method or function, it will not go into that function for further execution. Instead it will execute that function behind the scenes and go to the next line.
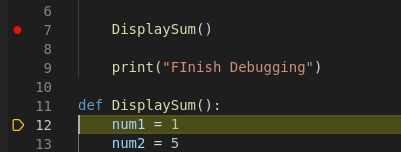
For example, if we go to the DisplaySum() function in line 7.
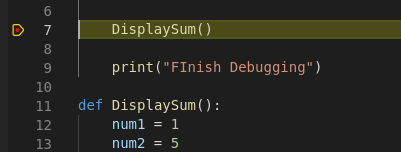
Then, when we hit the StepOver button, the debugger will go to the next line that has code, which is line 9, instead of moving to line 12 where the code for the DisplaySum() function begins. It will still execute the entire DisplaySum() function, it just wont step through it.
Stepping Into Code – Shortcut Key “F11”
THe third button![]() is the Step Into button. This will execute a line of code, but if that line contains a function of method, then it will go into that method or function to debug it’s code. For example
is the Step Into button. This will execute a line of code, but if that line contains a function of method, then it will go into that method or function to debug it’s code. For example
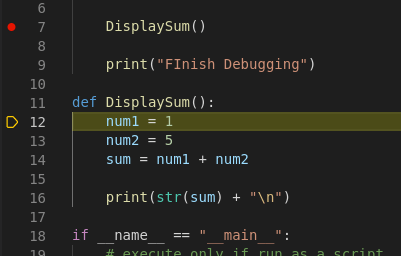
For example, if we go to the DisplaySum() function in line 7.
When we hit the Step Into button. It the debugger will go line 12 and start stepping through the DisplaySum() function.
Stepping Out of Code – Shortcut key “Shift+F11“
The fourth button![]() , is the Step Out button. When you are inside a method or function and just want to execute the rest of the functions code and leave the function, then this button will do that. You can then step into the rest of the code that’s outside the function.
, is the Step Out button. When you are inside a method or function and just want to execute the rest of the functions code and leave the function, then this button will do that. You can then step into the rest of the code that’s outside the function.
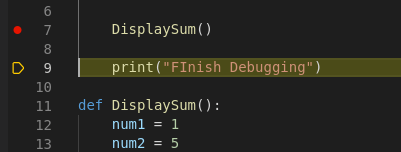
For example, if you are already on lines 12 through 16 and stepping through DisplaySum().
When you press Step Out, the debugger will continue until if finishes executing DisplaySum(). Then freeze at line 7.
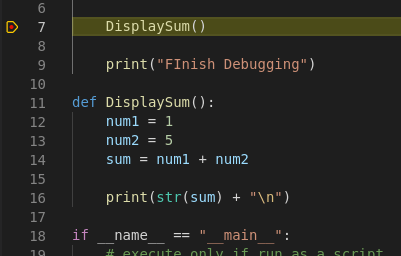
This is helpful if you are done debugging a specific function but want to continue debugging the overall code.
Other Debug Functions
The fifth button![]() , is the restart button and will just restart the debugging from the beggining of the code, and freeze when it reaches a breakpoint.
, is the restart button and will just restart the debugging from the beggining of the code, and freeze when it reaches a breakpoint.
The last button![]() , is the Stop Debugging button and it will do just that. Stop debugging your code so you continue coding.
, is the Stop Debugging button and it will do just that. Stop debugging your code so you continue coding.
Seeing variable values
A helpful part of debugging is seeing what values variables have at specific point in times.
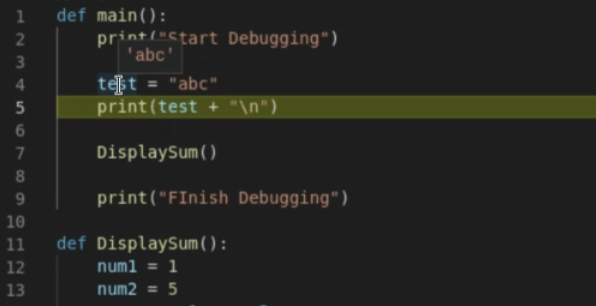
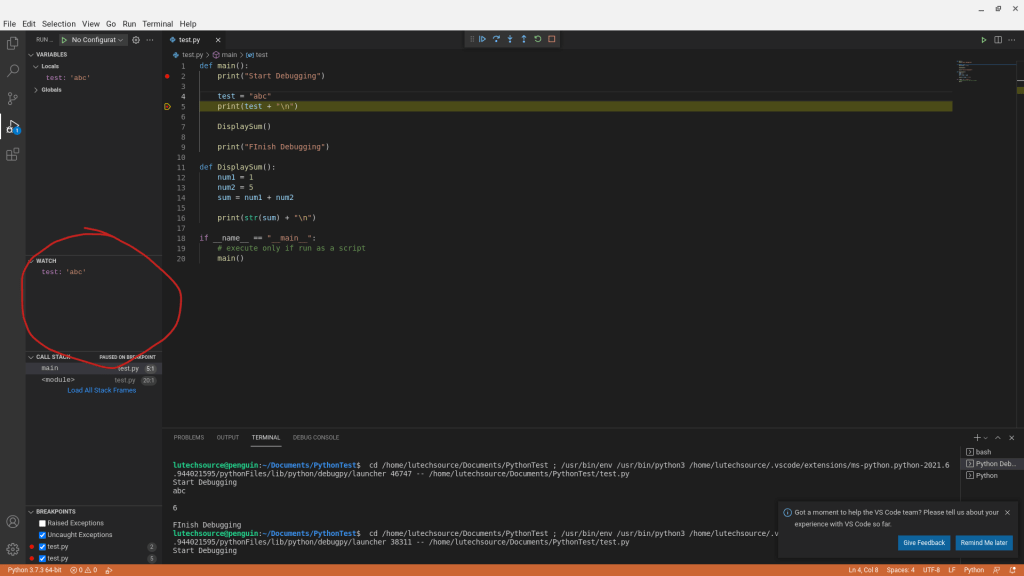
To view a value for a variable, the debugger must be frozen at a specific line. The below image shows the debugger frozen at line 5. I can then just hover my mouse over a variable and it’s value will then appear. Below you can view the value of the test variable right above it.
You can also constantly keep track of the variable by adding it to the Watch window circled below.
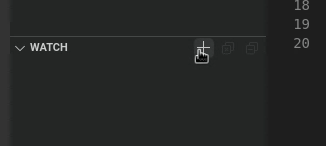
To add a variable you want to keep track of, click on the “+” sign in the watch window
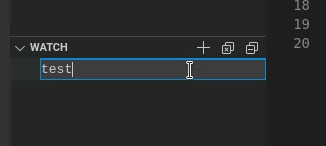
Then type the variable name you want to keep track of.
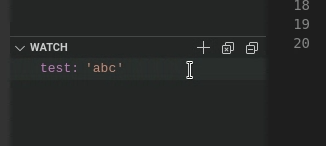
When you finish entering the variable name, you will see the value displayed next to it.
And that’s how you debug Python on a Chromebook under Visual Studio Code.
